
[RMSE] BusRidersPredic
import pandas as pd

train = pd.read_csv('data/train.csv')
test = pd.read_csv('data/test.csv')
bts = pd.read_csv('data/bus_bts.csv')
jeju_life = pd.read_csv('data/jeju_financial_life_data.csv')
weather = pd.read_csv('data/weather.csv', encoding='cp949')
rain = pd.read_csv('data/rain.csv', encoding='utf-8')
train.head()
| id | date | bus_route_id | in_out | station_code | station_name | latitude | longitude | 6~7_ride | 7~8_ride | ... | 9~10_ride | 10~11_ride | 11~12_ride | 6~7_takeoff | 7~8_takeoff | 8~9_takeoff | 9~10_takeoff | 10~11_takeoff | 11~12_takeoff | 18~20_ride | |
|---|---|---|---|---|---|---|---|---|---|---|---|---|---|---|---|---|---|---|---|---|---|
| 0 | 0 | 2019-09-01 | 4270000 | 시외 | 344 | 제주썬호텔 | 33.48990 | 126.49373 | 0.0 | 1.0 | ... | 5.0 | 2.0 | 6.0 | 0.0 | 0.0 | 0.0 | 0.0 | 0.0 | 0.0 | 0.0 |
| 1 | 1 | 2019-09-01 | 4270000 | 시외 | 357 | 한라병원 | 33.48944 | 126.48508 | 1.0 | 4.0 | ... | 2.0 | 5.0 | 6.0 | 0.0 | 0.0 | 0.0 | 0.0 | 0.0 | 0.0 | 5.0 |
| 2 | 2 | 2019-09-01 | 4270000 | 시외 | 432 | 정존마을 | 33.48181 | 126.47352 | 1.0 | 1.0 | ... | 2.0 | 0.0 | 0.0 | 0.0 | 0.0 | 0.0 | 0.0 | 0.0 | 0.0 | 2.0 |
| 3 | 3 | 2019-09-01 | 4270000 | 시내 | 1579 | 제주국제공항(600번) | 33.50577 | 126.49252 | 0.0 | 17.0 | ... | 26.0 | 14.0 | 16.0 | 0.0 | 0.0 | 0.0 | 0.0 | 0.0 | 0.0 | 53.0 |
| 4 | 4 | 2019-09-01 | 4270000 | 시내 | 1646 | 중문관광단지입구 | 33.25579 | 126.41260 | 0.0 | 0.0 | ... | 0.0 | 0.0 | 0.0 | 0.0 | 0.0 | 0.0 | 1.0 | 0.0 | 0.0 | 0.0 |
5 rows × 21 columns
train.info()
<class 'pandas.core.frame.DataFrame'>
RangeIndex: 415423 entries, 0 to 415422
Data columns (total 21 columns):
 #   Column         Non-Null Count   Dtype
---  ------         --------------   -----
 0   id             415423 non-null  int64
 1   date           415423 non-null  object
 2   bus_route_id   415423 non-null  int64
 3   in_out         415423 non-null  object
 4   station_code   415423 non-null  int64
 5   station_name   415423 non-null  object
 6   latitude       415423 non-null  float64
 7   longitude      415423 non-null  float64
 8   6~7_ride       415423 non-null  float64
 9   7~8_ride       415423 non-null  float64
 10  8~9_ride       415423 non-null  float64
 11  9~10_ride      415423 non-null  float64
 12  10~11_ride     415423 non-null  float64
 13  11~12_ride     415423 non-null  float64
 14  6~7_takeoff    415423 non-null  float64
 15  7~8_takeoff    415423 non-null  float64
 16  8~9_takeoff    415423 non-null  float64
 17  9~10_takeoff   415423 non-null  float64
 18  10~11_takeoff  415423 non-null  float64
 19  11~12_takeoff  415423 non-null  float64
 20  18~20_ride     415423 non-null  float64
dtypes: float64(15), int64(3), object(3)
memory usage: 66.6+ MB
bts.head()
| user_card_id | bus_route_id | vhc_id | geton_date | geton_time | geton_station_code | geton_station_name | getoff_date | getoff_time | getoff_station_code | getoff_station_name | user_category | user_count | |
|---|---|---|---|---|---|---|---|---|---|---|---|---|---|
| 0 | 1.010010e+15 | 23000000 | 149793674 | 2019-09-10 | 06:34:45 | 360 | 노형오거리 | 2019-09-10 | 07:10:31 | 592.0 | 화북초등학교 | 1 | 1 |
| 1 | 1.010010e+15 | 23000000 | 149793674 | 2019-09-10 | 06:34:58 | 360 | 노형오거리 | 2019-09-10 | 06:56:27 | 3273.0 | 고산동산(광양방면) | 1 | 1 |
| 2 | 1.019160e+15 | 21420000 | 149793535 | 2019-09-10 | 07:19:07 | 2495 | 동광환승정류장4(제주방면) | 2019-09-10 | 07:40:29 | 431.0 | 정존마을 | 4 | 1 |
| 3 | 1.019150e+15 | 21420000 | 149793512 | 2019-09-09 | 09:14:47 | 3282 | 대정환승정류장(대정읍사무소) | 2019-09-09 | 10:02:46 | 431.0 | 정존마을 | 1 | 1 |
| 4 | 1.010010e+15 | 21420000 | 149793512 | 2019-09-09 | 09:28:53 | 2820 | 삼정지에듀 | 2019-09-09 | 10:21:37 | 2972.0 | 제주국제공항(종점) | 4 | 1 |
bts.info(null_counts=True)
/Users/charles/Documents/GitHub/busRidersPredic/venv/lib/python3.7/site-packages/ipykernel_launcher.py:1: FutureWarning: null_counts is deprecated. Use show_counts instead
  """Entry point for launching an IPython kernel.


<class 'pandas.core.frame.DataFrame'>
RangeIndex: 2409414 entries, 0 to 2409413
Data columns (total 13 columns):
 #   Column               Non-Null Count    Dtype
---  ------               --------------    -----
 0   user_card_id         2409414 non-null  float64
 1   bus_route_id         2409414 non-null  int64
 2   vhc_id               2409414 non-null  int64
 3   geton_date           2409414 non-null  object
 4   geton_time           2409414 non-null  object
 5   geton_station_code   2409414 non-null  int64
 6   geton_station_name   2409365 non-null  object
 7   getoff_date          1513678 non-null  object
 8   getoff_time          1513678 non-null  object
 9   getoff_station_code  1513678 non-null  float64
 10  getoff_station_name  1513639 non-null  object
 11  user_category        2409414 non-null  int64
 12  user_count           2409414 non-null  int64
dtypes: float64(2), int64(5), object(6)
memory usage: 239.0+ MB
pd.options.display.max_info_columns
100
pd.options.display.max_info_rows
1690785
jeju_life.head()
| zip_cd | year_month | x_axis | y_axis | sex | age | job_majorc | job_smallc | job_public | job_profession | ... | avg_debt | avg_debt_credit | avg_debt_noneb | avg_debt_mortgage | avg_debt_deposit | avg_debt_collateral | avg_credit_rat | medium_resid_rat | large_resid_rat | vehicle_own_rat | |
|---|---|---|---|---|---|---|---|---|---|---|---|---|---|---|---|---|---|---|---|---|---|
| 0 | 63299 | 201902 | 126.565889 | 33.513210 | 1 | 54 | 0.0 | 0.166667 | 0.000000 | 0.000000 | ... | 24285196 | 11419148 | 8863595 | 55550000 | 0 | 55550000 | 5 | -999999.0 | -999999.0 | 0.000000 |
| 1 | 63560 | 201902 | 126.497121 | 33.247225 | 1 | 59 | 0.0 | 0.125000 | 0.000000 | 0.000000 | ... | 108571077 | 25896955 | 13317443 | 0 | 200000000 | 74421721 | 4 | -999999.0 | -999999.0 | 0.000000 |
| 2 | 63560 | 201902 | 126.497121 | 33.247225 | 2 | 49 | 0.0 | 0.250000 | 0.000000 | 0.000000 | ... | 26424335 | 12015311 | 12015311 | 40833359 | 0 | 40833359 | 2 | -999999.0 | -999999.0 | 0.000000 |
| 3 | 63560 | 201902 | 126.497121 | 33.247225 | 1 | 54 | 0.0 | 0.181818 | 0.090909 | 0.090909 | ... | 647716901 | 39952556 | 21558153 | 36697792 | 0 | 706300496 | 4 | -999999.0 | -999999.0 | 0.166667 |
| 4 | 63560 | 201902 | 126.497121 | 33.247225 | 1 | 49 | 0.0 | 0.250000 | 0.000000 | 0.000000 | ... | 248232725 | 35712501 | 5568751 | 0 | 0 | 626810674 | 5 | -999999.0 | -999999.0 | 0.000000 |
5 rows × 27 columns
jeju_life.info()
<class 'pandas.core.frame.DataFrame'>
RangeIndex: 10422 entries, 0 to 10421
Data columns (total 27 columns):
 #   Column               Non-Null Count  Dtype
---  ------               --------------  -----
 0   zip_cd               10422 non-null  int64
 1   year_month           10422 non-null  int64
 2   x_axis               10422 non-null  float64
 3   y_axis               10422 non-null  float64
 4   sex                  10422 non-null  int64
 5   age                  10422 non-null  int64
 6   job_majorc           10422 non-null  float64
 7   job_smallc           10422 non-null  float64
 8   job_public           10422 non-null  float64
 9   job_profession       10422 non-null  float64
 10  job_self             10422 non-null  float64
 11  job_none             10422 non-null  float64
 12  job_other            10422 non-null  float64
 13  avg_income           10422 non-null  int64
 14  med_income           10422 non-null  int64
 15  avg_spend            10422 non-null  int64
 16  avg_foreign_spend    10422 non-null  int64
 17  avg_debt             10422 non-null  int64
 18  avg_debt_credit      10422 non-null  int64
 19  avg_debt_noneb       10422 non-null  int64
 20  avg_debt_mortgage    10422 non-null  int64
 21  avg_debt_deposit     10422 non-null  int64
 22  avg_debt_collateral  10422 non-null  int64
 23  avg_credit_rat       10422 non-null  int64
 24  medium_resid_rat     10422 non-null  float64
 25  large_resid_rat      10422 non-null  float64
 26  vehicle_own_rat      10422 non-null  float64
dtypes: float64(12), int64(15)
memory usage: 2.1 MB
weather.head()
| 날짜 | 현재일기 | 현재기온 | 체감온도 | 일강수 | |
|---|---|---|---|---|---|
| 0 | 2019-09-01 | 흐림 | 26.2 | 75.0 | 0 |
| 1 | 2019-09-02 | 비 끝남 | 22.5 | 72.0 | 25.7 |
| 2 | 2019-09-03 | 흐림 | 25.4 | 77.0 | 12.1 |
| 3 | 2019-09-04 | 약한비단속 | 24.2 | 75.0 | 34.3 |
| 4 | 2019-09-05 | 구름많음 | 27.6 | 79.0 | 0.1 |
weather.info()
<class 'pandas.core.frame.DataFrame'>
RangeIndex: 46 entries, 0 to 45
Data columns (total 5 columns):
 #   Column  Non-Null Count  Dtype
---  ------  --------------  -----
 0   날짜      46 non-null     object
 1   현재일기    46 non-null     object
 2   현재기온    46 non-null     float64
 3   체감온도    46 non-null     float64
 4   일강수     46 non-null     object
dtypes: float64(2), object(3)
memory usage: 1.9+ KB
rain.head()
| 지점 | 일시 | 기온(°C) | 강수량(mm) | |
|---|---|---|---|---|
| 0 | gosan | 2019-09-01 | 23.916667 | 0.00 |
| 1 | gosan | 2019-09-02 | 23.700000 | 12.10 |
| 2 | gosan | 2019-09-03 | 23.550000 | 1.90 |
| 3 | gosan | 2019-09-04 | 23.533333 | 12.84 |
| 4 | gosan | 2019-09-05 | 26.033333 | 0.00 |
rain.info()
<class 'pandas.core.frame.DataFrame'>
RangeIndex: 184 entries, 0 to 183
Data columns (total 4 columns):
 #   Column   Non-Null Count  Dtype
---  ------   --------------  -----
 0   지점       184 non-null    object
 1   일시       184 non-null    object
 2   기온(°C)   184 non-null    float64
 3   강수량(mm)  66 non-null     float64
dtypes: float64(2), object(2)
memory usage: 5.9+ KB
import matplotlib
import matplotlib.pyplot as plt
import seaborn as sns

# 내부에 결과를 출력하도록 설정
%matplotlib inline

# 시각화 한글 폰트 설정
# window 사용자
# plt.rc('font', family='Malgun Gothic')
# macOS 사용자
plt.rc('font', family='AppleGothic')

plt.rc('axes', unicode_minus=False)

# 분석에 문제가 없는 경고 메시지는 숨긴다.
import warnings
warnings.filterwarnings('ignore')
# 학습 데이터 복사본 생성
traindata = train.copy()
# 타깃 변수(퇴근시간 승차인원) 분포 시각화
sns.distplot(traindata['18~20_ride'], kde=False, bins=50)
plt.axis([0, 50, 0, 450000])
plt.title("퇴근 시간 승차 인원 히스토그램")
plt.show()
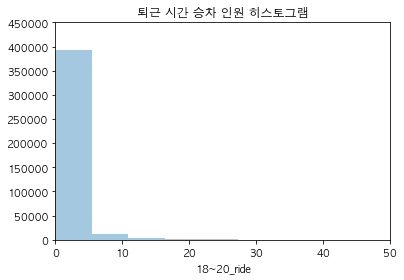
traindata.groupby('18~20_ride').size().head()
18~20_ride
0.0    296528
1.0     44268
2.0     23752
3.0     13560
4.0      8630
dtype: int64
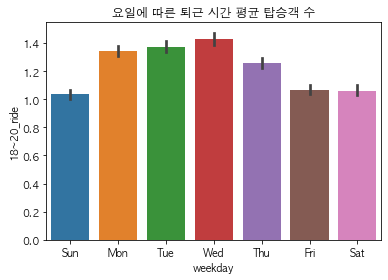
# 요일 변수 생성
# 날짜 형으로 변환
traindata['date'] = pd.to_datetime(traindata['date'])
# 요일을 문자형으로 추출해 변수 생성
traindata['weekday'] = traindata['date'].dt.strftime('%a')
traindata[['date', 'weekday']].head()
| date | weekday | |
|---|---|---|
| 0 | 2019-09-01 | Sun |
| 1 | 2019-09-01 | Sun |
| 2 | 2019-09-01 | Sun |
| 3 | 2019-09-01 | Sun |
| 4 | 2019-09-01 | Sun |
traindata[['date', 'weekday']].info()
<class 'pandas.core.frame.DataFrame'>
RangeIndex: 415423 entries, 0 to 415422
Data columns (total 2 columns):
 #   Column   Non-Null Count   Dtype
---  ------   --------------   -----
 0   date     415423 non-null  datetime64[ns]
 1   weekday  415423 non-null  object
dtypes: datetime64[ns](1), object(1)
memory usage: 6.3+ MB
# 요일별 퇴근시간 평균 탑승객 수 시각화
sns.barplot(x="weekday", y="18~20_ride", data=traindata)
plt.title("요일에 따른 퇴근 시간 평균 탑승객 수")     # number of riders at rushour by weekday
plt.show
<function matplotlib.pyplot.show(close=None, block=None)>
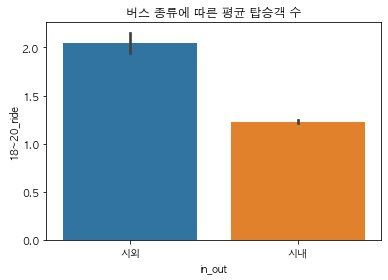
# 버스 종류별 퇴근시간 평균 탑승객 수 시각화
sns.barplot(x="in_out", y="18~20_ride", data=traindata)
plt.title("버스 종류에 따른 평균 탑승객 수")       # number of riders by busType
plt.show()
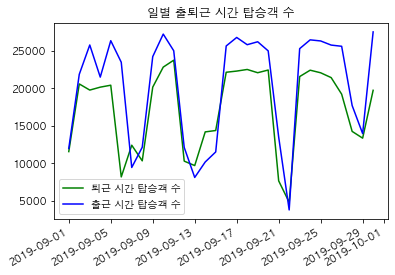
# 일별 출퇴근 시간의 총 승차 인원 데이터 생성
traindata['8~10_ride'] = traindata['8~9_ride'] + traindata['9~10_ride']
eda_data = traindata.groupby('date')[['18~20_ride', '8~10_ride']].agg('sum').reset_index()
eda_data.head()
| date | 18~20_ride | 8~10_ride | |
|---|---|---|---|
| 0 | 2019-09-01 | 11537.0 | 11957.0 |
| 1 | 2019-09-02 | 20561.0 | 21844.0 |
| 2 | 2019-09-03 | 19743.0 | 25756.0 |
| 3 | 2019-09-04 | 20133.0 | 21472.0 |
| 4 | 2019-09-05 | 20392.0 | 26331.0 |
# 일별 출퇴근 시간 탑승객 수 시각화
plt.plot("date", "18~20_ride", "g-", label="퇴근 시간 탑승객 수", data=eda_data)
plt.plot("date", "8~10_ride", "b-", label="출근 시간 탑승객 수", data=eda_data)
plt.gcf().autofmt_xdate()         # x축의 라벨이 서로 겹치지 않도록 설정
plt.legend(loc=0)                 # 그래프 상에서 최적의 위치에 범례 표시
plt.title("일별 출퇴근 시간 탑승객 수")
plt.show()

Leave a comment